Sales Analytics and CRM Reporting You Can Actually Trust
Most reports are a spreadsheet someone rebuilds the night before the review. KudosCRM does it differently. Your sales analytics run on live records, so five reports are ready on day one, the Command Center shows the number before anyone asks, and an audit log sits behind every figure. In your currency, with no assembly required.
The Short Version
What is Sales Analytics?
Sales analytics turns the records already in your CRM into answers: how the pipeline is converting, who is tracking to quota, and what is likely to close this quarter. Instead of exporting data to a separate tool, you read the business where the work happens.
KudosCRM runs CRM analytics on one spine. Every module writes to the same record, so a report and a dashboard never disagree, and the forecast is built from the same deals your pipeline shows. Behind each figure sits an audit log that shows exactly what produced it.
The Problem
Nobody Fully Trusts the Number in the Board Deck
Somebody stitched it together by hand from exports that drifted apart the moment the data changed. The forecast was typed in from memory. The dashboard says one thing, the report says another, and when a director asks where a figure came from, the room goes quiet.
- ✕A forecast typed by hand, already stale when it lands
- ✕Reports and dashboards that quietly disagree with each other
- ✕No way to trace a number back to whatever produced it
How KudosCRM Handles It
Numbers From Real Activity, Already on Screen
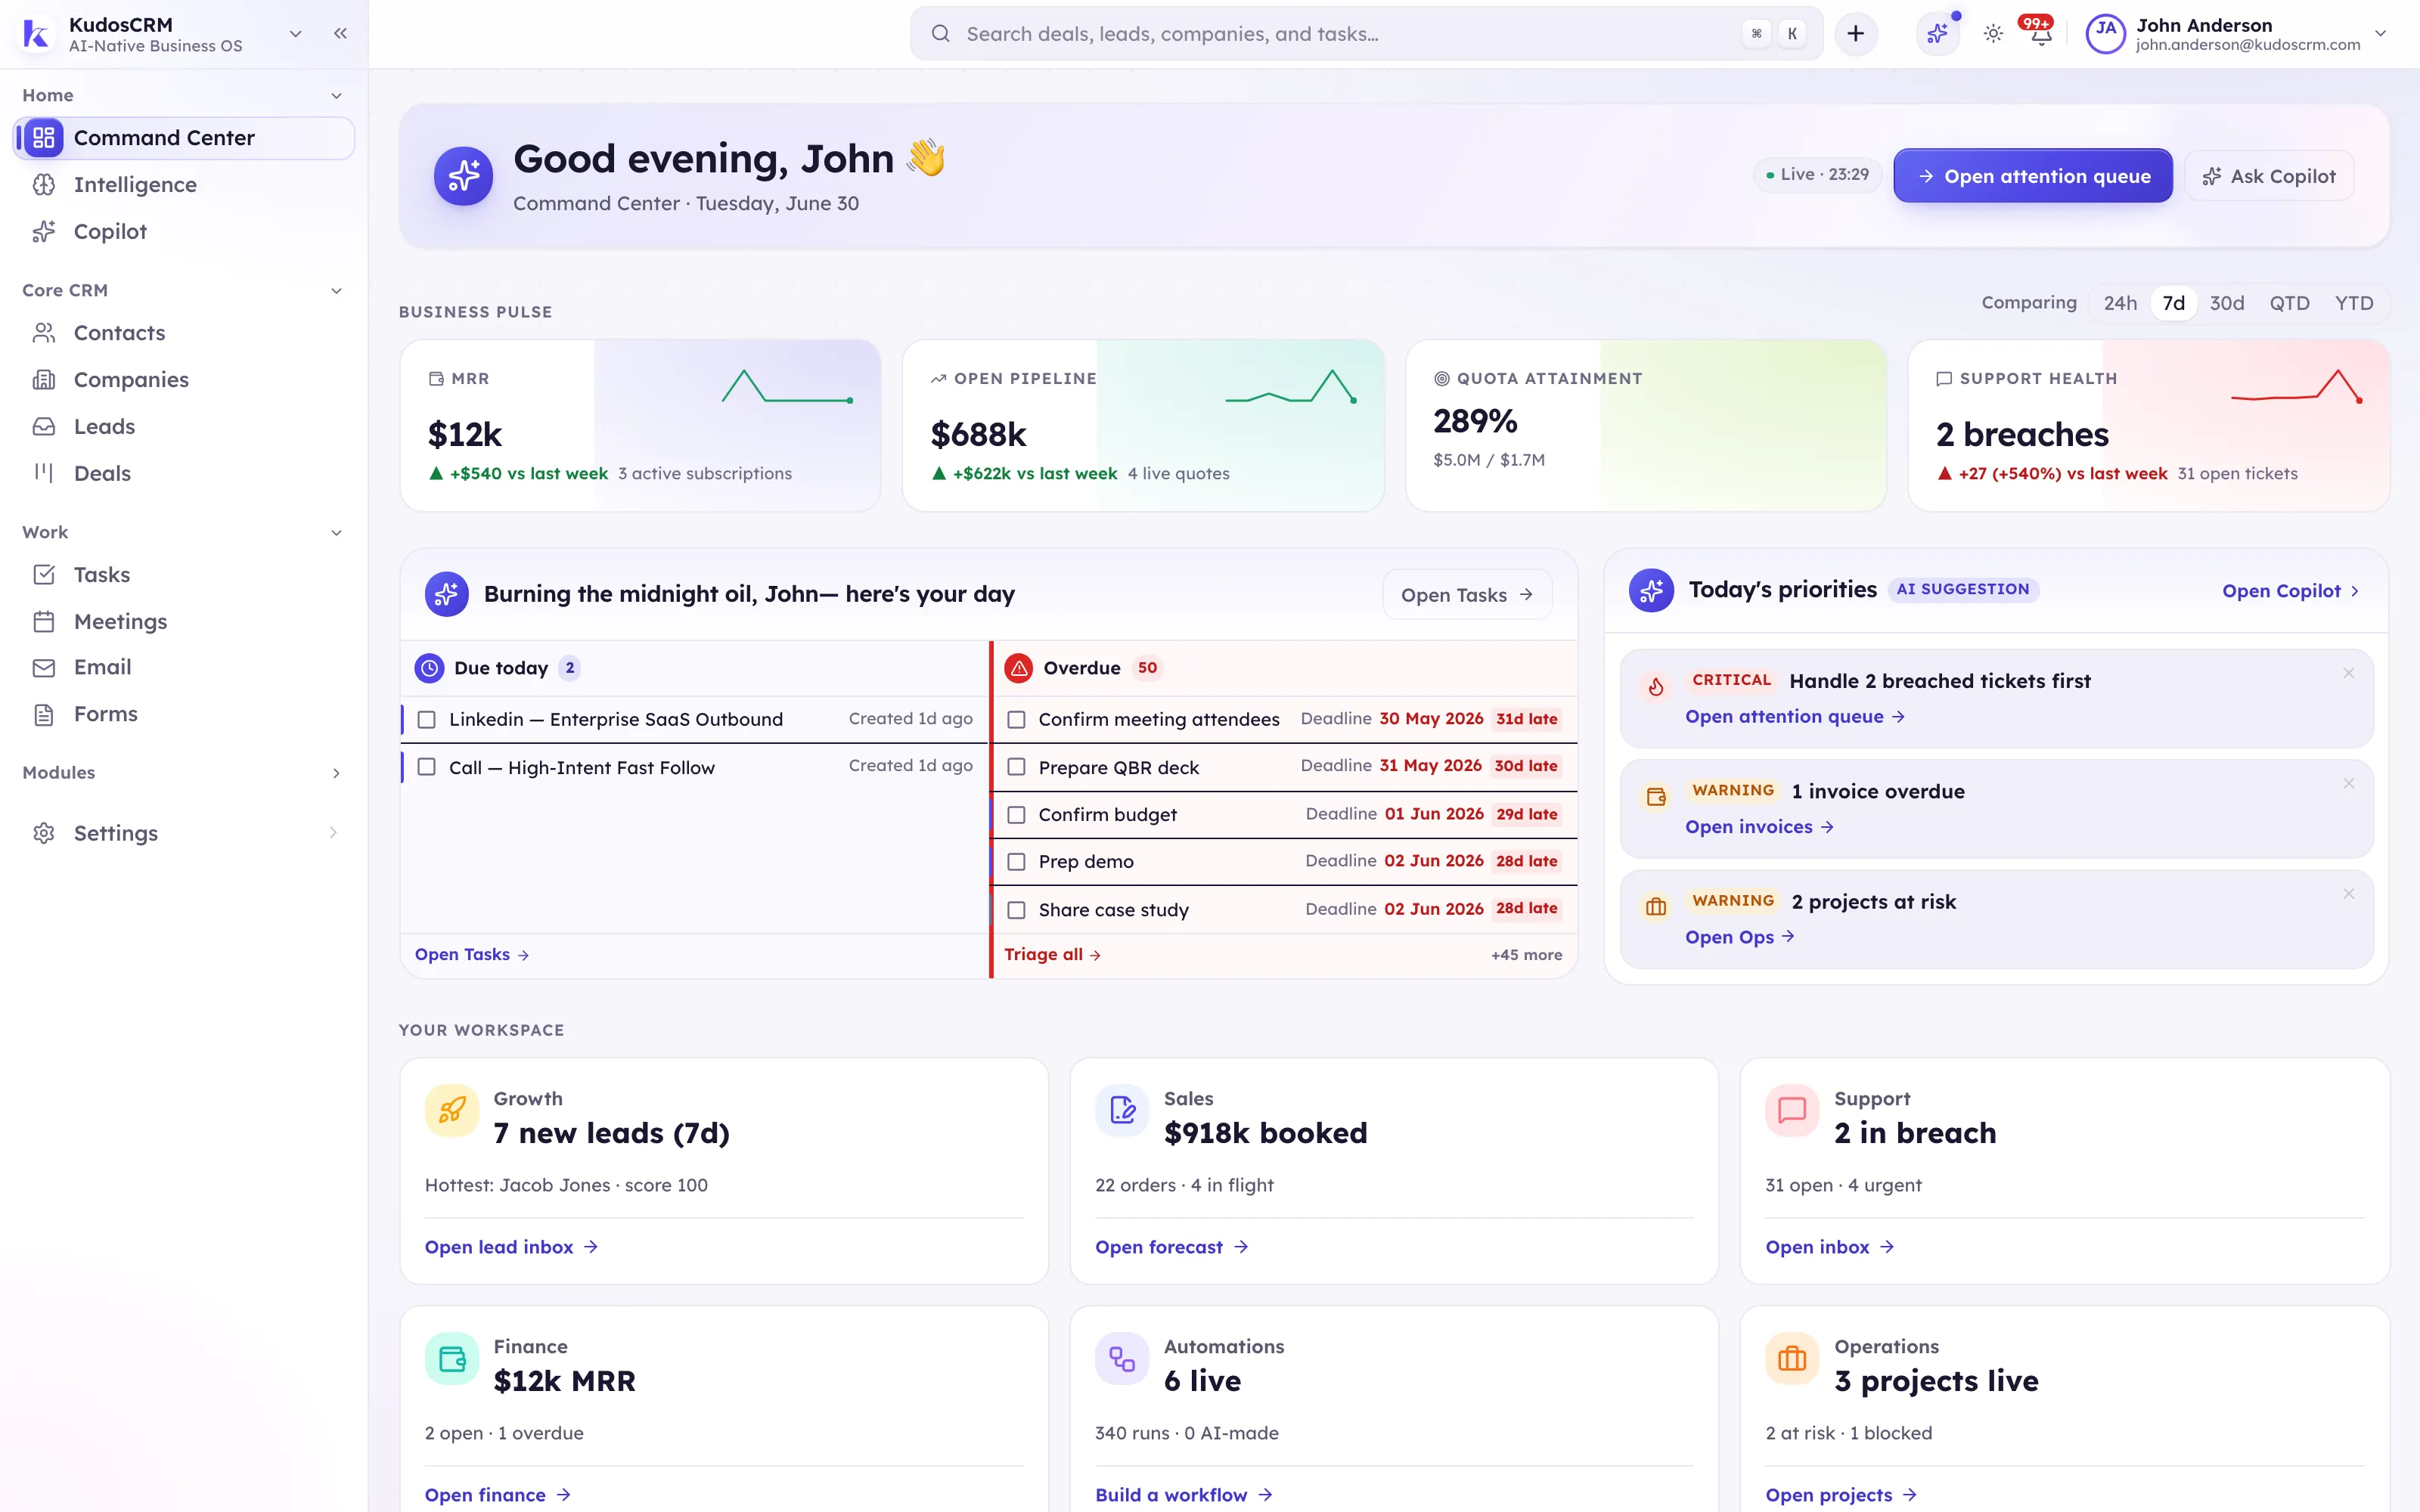
Your CRM reporting reads live records rather than a snapshot someone remembered to take. Five reports come built. The Command Center puts the weighted forecast on your home screen. Figures render in your workspace currency automatically. And because every module reports off the same spine, the question stops being “do we trust this?” and becomes “what do we do about it?”
- ✓Five sales reports ready on day one, filterable and exportable
- ✓A weighted forecast built from stage probability, not optimism
- ✓An audit log behind every figure, with a before and after diff
The Reporting Loop
From Login to Decision, on One Record
Five moments, and not one of them involves rebuilding a spreadsheet.
Step 1
Open to your day
The Command Center loads with your open deals, your tasks, pipeline health, recent activity, and the weighted revenue forecast. The number is on screen before the question arrives.
Step 2
Read the report that fits
Deal performance, sales funnel, activity, revenue forecast, or task productivity. Filter by owner, stage, or date range, and the figures recalculate against live data.
Step 3
Weight the quarter honestly
Every open deal carries its stage probability against its value. Override an individual deal when you know something the model does not.
Step 4
Zoom out to the whole business
Ops Mission Control pulls sales, delivery, and support into a single pulse, so a healthy pipeline sitting on top of a failing delivery team is visible in one view.
Step 5
Prove it when asked
The audit log shows who changed what and when, with a before and after diff. Your sales reporting becomes an audit trail rather than a snapshot nobody can defend.
The Analytics System
Read the Business, Forecast the Quarter, Prove the Number
Reports, dashboards, the forecast, and the cross-module view all run on the same record. Nothing is re-keyed, and nothing drifts out of sync.
Five reports, ready to read
Deal performance, sales funnel, activity, revenue forecast, and task productivity, built from live tenant-scoped data. Filter them, then export the view to CSV.
Reports & dashboardsThe Command Center
Open the app to “Your Day”: open deals and tasks, pipeline health, recent activity, and the weighted revenue forecast on one home screen. Add the multi-pipeline deals hub with Kanban, list, forecast, and timeline views, plus saved and smart views for stalled or at-risk work. Everything is permission aware, and it updates live across every open tab.
Sales dashboardA forecast you can defend
Every open deal is weighted by stage probability against its value, with a per-deal probability override when you know better. Alongside it sit quota attainment by rep, team, and period, win rate, average deal size, sales-cycle length, pipeline velocity, stage conversion, forecast by owner, territory, and pipeline, and a rep leaderboard.
Sales forecastingOps Mission Control
One cross-module view of the whole business. Ops Pulse shows sales, delivery, and support health together. My Work gathers everything assigned to you across every module. Team workload shows capacity before it breaks, and delivery reports cover cycle time, on-time percentage, throughput, and budget.
Delivery & projectsAnalytics in every module
Email deliverability with opens, clicks, and bounces. Booking and meeting insights. Automation run analytics covering success, failure, and volume. Territory performance and overlap, product performance, storage usage, and campaign engagement. Each module reports on itself, on the same spine.
Email analyticsAn audit trail behind every number
Because every module writes to one record, a figure traces back to the change that produced it. The audit log shows who changed what and when, with a before and after diff and a retention policy we state plainly.
Security & auditWhat Happens the Moment a Deal Moves?
Four things update before anyone runs a report.
The reports recalculate
Deal performance, the funnel, and win rate all read live records, so the change is reflected the moment it happens.
The forecast reweights
The deal's new stage carries a new probability, and the forecast categories shift with it.
The Command Center refreshes
Pipeline health and the weighted forecast update live on the home screen, across every open tab.
The audit log records it
Who moved it, when, and what it looked like before. The number stays traceable no matter how many times it changes.

What's Actually in the Box
Everything Analytics and Reports Gives You
Live today, unless marked Soon — roadmap items are shown honestly rather than faked.
Pre-built reports
Deal performance: won / lost / open by owner, with win rate
Sales funnel: per-stage counts plus stage-to-stage conversion
Sales activity: activities per rep, broken down by type
Revenue forecast: month by month, won / committed / likely / pipeline
Task productivity: created / completed / overdue plus completion rate
One-click CSV export (RFC-4180, UTF-8) on all five
Figures render in your workspace currency (USD, EUR and more, via Intl)
Command Center & dashboards
“Your Day” home: open deals, tasks, pipeline health, recent activity
Weighted revenue forecast on the dashboard
Multi-pipeline deals hub: Kanban, list, forecast, and timeline views
Saved and smart views (stalled, at-risk) you can return to
Permission aware, so people only see what they are allowed to
Real-time, multi-tab live updates
Composable custom dashboards with drag-and-drop report cards Soon
Natural-language “ask your data” Q&A Soon
Forecast & performance
Weighted forecast: stage probability × value, with a per-deal override
Forecast categories on the deal: committed / likely / pipeline
Quota attainment: percentage to target by rep, team, or period
Win rate, average deal size, and sales-cycle length
Pipeline velocity and stage conversion
Forecast by owner, territory, and pipeline
Rep leaderboard
Predictive win-probability and risk scoring Soon
Ops Mission Control (cross-module)
Ops Pulse: sales, delivery, and support health in one view
My Work: everything assigned to you, across every module
Team workload and capacity
Delivery reports: cycle time, on-time percentage, throughput, and budget
Ops AI Standup: a grounded daily digest from Kudos AI
Analytics in every module
Email analytics and deliverability: opens, clicks, bounces
Booking and meeting insights
Automation run analytics: success, failure, and volume
Territory performance and overlap detection
Product performance and storage usage
Campaign engagement reporting
Campaign cost and ROI rollups (needs ad-spend and revenue sync) Soon
Trust & governance
Audit log: who changed what, with a before and after diff
A data-retention policy we state plainly
One spine, so every figure traces to the record that produced it
Multi-currency and FX conversion Soon
On the Roadmap
What's Coming to Analytics
We would rather show you the roadmap than fake a screenshot. These are in progress, not live. Ask us where they stand if one is a deciding factor.
Composable custom dashboards
Drag-and-drop report cards, so you can build the dashboard your team actually wants instead of working from the five we ship.
Ask your data in plain language
Type the question, get the figure. Natural-language Q&A on top of the reports you filter by owner, stage, and date now.
Predictive win-probability and risk scoring
A learned model on top of the stage-probability forecast, scoring which deals are actually at risk. We will ship it when it is honest, not before.
Campaign cost and ROI rollups
Full return-on-investment per campaign, which needs ad-spend and revenue sync to sit alongside the engagement reporting you already get.
Multi-currency and FX conversion
Convert across several currencies at once with live FX rates, rather than rendering every figure in one workspace currency.
See It in the Product
From Your Day to the Standup
Your day, the moment you log in
The Command Center opens to what needs you: open deals, tasks, pipeline health, recent activity, and the weighted forecast. No report to run before you know where things stand.
Reports, already built
Open deal performance, the sales funnel, activity, the revenue forecast, or task productivity. Filter by owner, stage, or date, then export the view to CSV. Figures render in your currency.

The cross-module standup, written for you
Ops Mission Control rolls sales, delivery, and support into one pulse, and the Kudos AI standup turns it into a grounded daily digest that points at the real records at risk.

CRM Reporting for Every Industry
Every industry measures success differently. KudosCRM gives each one CRM analytics on a single record, so the pipeline, the delivery work, and the revenue history all report off the same spine.
Report on Your Numbers, Then Take Them Anywhere
KudosCRM connects with tools like Gmail, Outlook, Slack, Google Calendar, and Zoom, so the activity your reports measure gets captured automatically rather than typed in. When a number needs to leave, one-click CSV export in RFC-4180 format opens cleanly in Excel, Google Sheets, or any BI tool you already run.
See All Integrations






FAQ
Frequently Asked Questions
Trust Your Numbers
See the Whole Business on One Record
Five reports ready on day one, a forecast you can defend, and an audit trail behind every figure. Start free, bring your whole team, cancel any time.